• Hi, I am the owner and main administrator of Styleforum. If you find the forum useful and fun, please help support it by buying through the posted links on the forum. Our main, very popular sales thread, where the latest and best sales are listed, are posted HERE

    Purchases made through some of our links earns a commission for the forum and allows us to do the work of maintaining and improving it. Finally, thanks for being a part of this community. We realize that there are many choices today on the internet, and we have all of you to thank for making Styleforum the foremost destination for discussions of menswear.
  • This site contains affiliate links for which Styleforum may be compensated.
  • STYLE. COMMUNITY. GREAT CLOTHING.

    Bored of counting likes on social networks? At Styleforum, you’ll find rousing discussions that go beyond strings of emojis.

    Click Here to join Styleforum's thousands of style enthusiasts today!

    Styleforum is supported in part by commission earning affiliate links sitewide. Please support us by using them. You may learn more here.

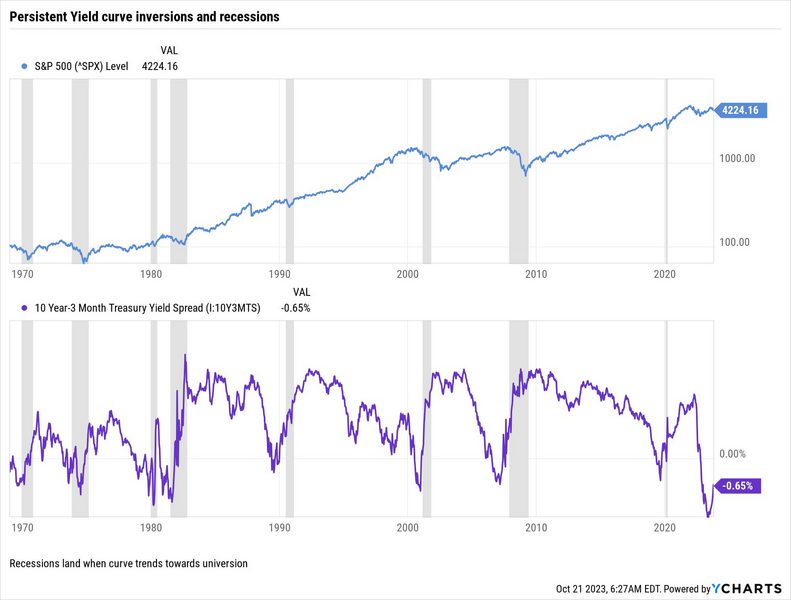
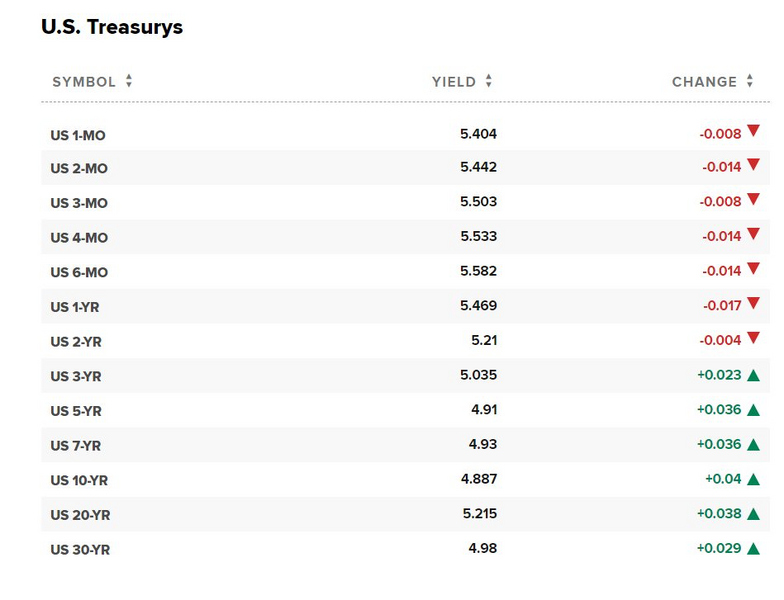
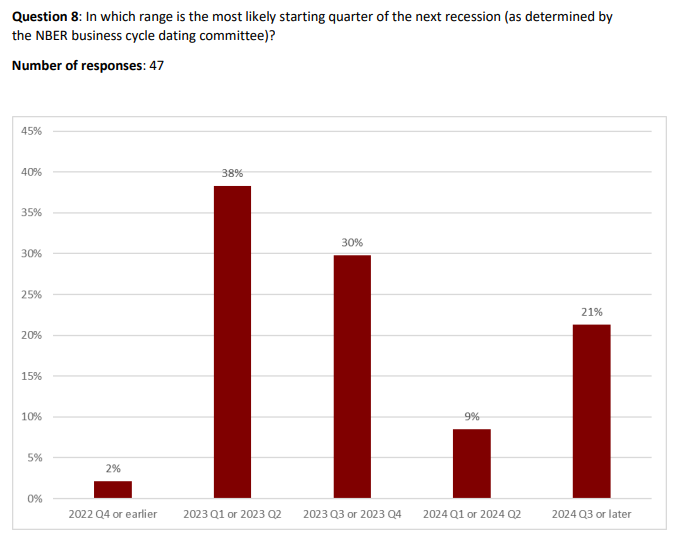
Talking stocks, trading, and investing in general

Texasmade

Stylish Dinosaur
Supporting Member
Joined
Apr 26, 2008
Messages
28,551
Reaction score
37,541
I'd rather you do some minimal speaking so I don't have figure it out.
 

Piobaire

Not left of center?
Joined
Dec 5, 2006
Messages
81,812
Reaction score
63,321
Last week, the dividend yield on the S&P500 was lower than the 10 year Treasury yield. What is the excess of beta for the market over the ten year Treasury? Yes, there are other elements of return to holding the equity, including capital gains/growth, but when the cash yield on a portfolio with a beta of 1 is roughly the same as the cash yield on a security with a beta probably 1/5th that, I start to wonder.

Seeking education here. How does the market have "excess beta" when I thought the market was the benchmark for beta = 1 and individual stocks were given a beta relative to the market's beta = 1?
 

gnatty8

Stylish Dinosaur
Joined
Nov 12, 2006
Messages
12,657
Reaction score
6,185
Really? I'd be surprised if Dow did not hit 35k in 2021

Shiller's PE10 is right around the 98th percentile right now. Of course it hit 44 right before the tech bubble burst, so 35K is not outside the realm of possibility. The question is does it stay there and if so, what does that imply for equity prices over the next 10 years. At a certain point, don't people ask themselves just what it is they are buying when they invest in a stock or index?
 

gnatty8

Stylish Dinosaur
Joined
Nov 12, 2006
Messages
12,657
Reaction score
6,185
Seeking education here. How does the market have "excess beta" when I thought the market was the benchmark for beta = 1 and individual stocks were given a beta relative to the market's beta = 1?

I mean beta relative to the 10 year Treasury
 

jbarwick

Distinguished Member
Joined
Nov 28, 2012
Messages
8,719
Reaction score
9,669
People always bring up the Shiller PE as some bell to ring. Now without looking, what was the Shiller PE at the bottom in 2009? How long did it stay below the average Shiller PE at the time?
 

gnatty8

Stylish Dinosaur
Joined
Nov 12, 2006
Messages
12,657
Reaction score
6,185
People always bring up the Shiller PE as some bell to ring. Now without looking, what was the Shiller PE at the bottom in 2009? How long did it stay below the average Shiller PE at the time?

Currently, we are close to 3 standard deviations above the long term geometric mean. In 2009, the measure bottomed out well short of 1 standard deviation below that long term mean.
 

gdl203

Purveyor of the Secret Sauce
Affiliate Vendor
Dubiously Honored
Supporting Member
Joined
Jun 9, 2005
Messages
45,619
Reaction score
54,462
Come on now, a picture is worth a thousands words, so I've given you 3,000 from the kindness of my heart
Are the graphs meant to illustrate all the dumb money going into the market? Maybe reminiscent of 1999 and all the retail money day trading on all those new E-Trade types of platforms?

I don't disagree that there's a Robinhood bubble somewhere in here. But I also think that we're on the verge of the most dramatic economic recovery curve we've ever seen in modern days. Monetary policy, stimulus spending, high consumer savings, pent up demand for entire segments of the economy, not to mention healthcare demand is now up a step function from pre-Covid, etc... Perfect storm scenario. There's a reason institutional investors are long this market. It has a significant potential for upside surprise.

(and I was taught financial markets by Roubini so I'm not always a rosy outlook guy)
 

gdl203

Purveyor of the Secret Sauce
Affiliate Vendor
Dubiously Honored
Supporting Member
Joined
Jun 9, 2005
Messages
45,619
Reaction score
54,462
Currently, we are close to 3 standard deviations above the long term geometric mean. In 2009, the measure bottomed out well short of 1 standard deviation below that long term mean.
With so much of the market's value in tech stocks, it's debatable how we should use historical PEs. Maybe we should split the market's cap between tech (and use historical PEG) and non tech (use historical PE) - and sum the parts
 

jbarwick

Distinguished Member
Joined
Nov 28, 2012
Messages
8,719
Reaction score
9,669
Be bearish then. You come out after a 5% drop and bang your bell the world is ending. It's very likely your hand sitting has cost you more money than calling any potential drop correctly. Plus, like last time you did this, you said you would be scared to buy-in thus capturing from your crystal ball calling.

See you again next time for another prediction. . .
 

Piobaire

Not left of center?
Joined
Dec 5, 2006
Messages
81,812
Reaction score
63,321
Are the graphs meant to illustrate all the dumb money going into the market? Maybe reminiscent of 1999 and all the retail money day trading on all those new E-Trade types of platforms?

I don't disagree that there's a Robinhood bubble somewhere in here. But I also think that we're on the verge of the most dramatic economic recovery curve we've ever seen in modern days. Monetary policy, stimulus spending, high consumer savings, pent up demand for entire segments of the economy, not to mention healthcare demand is now up a step function from pre-Covid, etc... Perfect storm scenario. There's a reason institutional investors are long this market. It has a significant potential for upside surprise.

(and I was taught financial markets by Roubini so I'm not always a rosy outlook guy)

There's been a thought we'll get our own "Roaring 20s" for exactly this reason, and not for nothing, the original R-20s came after the Spanish Flu pandemic.
 

nootje

Distinguished Member
Joined
Jul 14, 2008
Messages
5,579
Reaction score
5,278
There's been a thought we'll get our own "Roaring 20s" for exactly this reason, and not for nothing, the original R-20s came after the Spanish Flu pandemic.
Which came on the heels of mass mobilization and entire economies geared towards war returning to civilian live. I’ve heard that comparison a lot, but we where on the gold standard back then, trade patterns where very different and again, the world came out of a very destructive war.
 

gnatty8

Stylish Dinosaur
Joined
Nov 12, 2006
Messages
12,657
Reaction score
6,185
Are the graphs meant to illustrate all the dumb money going into the market? Maybe reminiscent of 1999 and all the retail money day trading on all those new E-Trade types of platforms?

I don't disagree that there's a Robinhood bubble somewhere in here. But I also think that we're on the verge of the most dramatic economic recovery curve we've ever seen in modern days. Monetary policy, stimulus spending, high consumer savings, pent up demand for entire segments of the economy, not to mention healthcare demand is now up a step function from pre-Covid, etc... Perfect storm scenario. There's a reason institutional investors are long this market. It has a significant potential for upside surprise.

(and I was taught financial markets by Roubini so I'm not always a rosy outlook guy)

They were tongue in cheek, and not serious indicators of dumb money. Again, I tend to look at valuations, especially relative valuations. All of the factors you mention above will likely very much boost earnings/growth for the next year or two, but then what? If the market is a portfolio of individual equities, all based on the current risk-adjusted value of their future cash returns over a very long holding period, then those very short term positives - pent up demand, loose fiscal policy, loose monetary policy (all of which are also highly inflationary) show really only impact asset prices marginally. However, when we look at indicators of value (Tobin's Q, which is a measure of the "market to book" or market to replacement cost of assets, is at an all time high of close to 3X, compared to its previous peak (Tech-Bubble) of about 2.2X) like the CAPE ratio, market to book, P/E, whatever you want to refer to, they all just seem to lack sanity. Further, when I do a DCF on the S&P's current value, it implies an equity risk premium of about 180 bps! In other words, the amount of return we earn for assuming the risk of a basket of stocks relative to holding a Treasury is barely 2 percentage points. Over very long periods of the past, this has looked more like 6% to 7%. Most people I know would probably guess that this value should be 4% to 6%, and that is what they'd use in estimating their own WACC for hurdle rates and capital budgeting. Even using the bottom end of that range results in a 1 handle for the S&P500 at its current dividend yield.

Again, I'd be happy to be wrong, but I am just puzzled by these valuations and how we can make sense of them. In the mid-2000s I was offered a job in southern California, and as an "outsider", could not wrap my head around housing prices. Similarly, I just cannot do the same here, despite my attempts to do so.
 

gnatty8

Stylish Dinosaur
Joined
Nov 12, 2006
Messages
12,657
Reaction score
6,185
With so much of the market's value in tech stocks, it's debatable how we should use historical PEs. Maybe we should split the market's cap between tech (and use historical PEG) and non tech (use historical PE) - and sum the parts

Fair enough. I did a quick Google search and the FAANG stocks represent about 15% of the S&P500, so yes, a large part of the growth and poor valuations of the overall index are probably driven by these five alone, but most of us invest in indexes, not the S&P500 less FAANG so unless we are investing in individual stocks or small baskets of stocks with more reasonable valuations, as goes FAANG so goes 15% of the market. Also, I am not so sure we can just differentiate today's tech stocks from the Nifty Fifty of the last generation, or even the generation of tech stocks that fueled the prior bubble, which all had compelling stories and firm believers. At some point it becomes about productivity, producing things people need and want, and delivering on growth and eventually returning cash to investors.
 

Featured Sponsor

How important is full vs half canvas to you for heavier sport jackets?

  • Definitely full canvas only

    Votes: 85 37.6%
  • Half canvas is fine

    Votes: 86 38.1%
  • Really don't care

    Votes: 24 10.6%
  • Depends on fabric

    Votes: 35 15.5%
  • Depends on price

    Votes: 36 15.9%

Forum statistics

Threads
506,431
Messages
10,589,211
Members
224,230
Latest member
KrystalMcclain
Top